I need to come back to this spot and give this shot another, wider try. But I liked it enough to post.
This is one of the stairwells in the biology building, a spot I particularly like. (More content below)
I did go back a little later and took this wider shot, which I like a lot more:
I put together the video below, which has a long intro (:-p) and a hidden something or other, which is kind of embarrassing, as the end.
And I'll leave you with this Facebook gem. My friend Dan apparently had a bit of trouble with his lab lizards today:
Wednesday, February 22, 2012
Sunday, February 19, 2012
Resurrecting old lines of transformed diatoms
I've begun the process of resurrecting old lines of transformed diatoms for future use in experiments in my lab. These diatom cells are from the original agar plates used in the particle bombardment genetic transformations. Currently, I have about 30 discrete lines of diatoms, each with one of my four different experimental plasmid DNA constructs. I'd like to dramatically increase that number if the need arises. The goal is to have a giant pool of diatoms, separated by the type of DNA with which they were transformed.
The overall process is outlined below:
As I stated in the graphic, these lines of diatoms come from the original transformation plates I used to start the discrete lines of diatoms I have now. After using them, I placed them underneath the rack where I grow my diatoms. As this shelf is not a solid plane, limited light did reach these plates. However, the amount of light they did receive was very limited in comparison to the normal growth conditions. This was the only reason why these cells appeared to be alive when I looked at them again recently.
When I was selecting for lines of diatoms back in August/September, I first plated the cells from liquid culture (the original plates I'm discussing now) to be used in the transformation, scraped those cells into liquid culture (much like the diagram above), and then plated the cells again after a recovery period. These cells plated on fresh plates were then left in constant light after they were used to inoculate liquid cultures. After sitting in this light for months on end, they soon faded from their usual brown hue to white. These cells died.
But the original transformation plates, sitting in a dark, cool place, were still brown. Even though they had been sitting on plates without selection (and more importantly without the addition of fresh nutrients), they appeared to still have some life in them.
So I scraped off as many cells from each transformation plate and transferred them into liquid cultures, without any selection. At this point, I had four different test tubes, one for each of my different plasmid constructs transformed into the diatoms. After a week of surprisingly rampant growth, I decided to see if they were still resistant to antibiotics.
Which they were! YEAH SCIENCE!
This past week I have since transferred them to larger liquid cultures to allow the resistant clones to proliferate. I will then plate all of these cells onto multiple selective agar plates, and allow them to grow up before placing them in a cooler, darker place in the culture room.
Until I plate my cultures and select for single colonies (as shown in the last stage of the graphic), I will have "pools" of transformed diatoms for each of my constructs: two different constructs for the nitrate reductase and and nitrite reductase genes. Because of the random insertion of the plasmid DNA into the genomic DNA of the diatom from the particle bombardment, each clone we can separate from the rest of the pool will be distinct from all of the others. This means we have the potential of growing hundreds of different lines of diatoms given the opportunity (or from what was left on the transformation plates).
It will be interesting to see what I do with these lines. If I have time this summer and some money to support me, I may try playing around with different culturing techniques to bolster a manuscript to submit to a journal.
The overall process is outlined below:
![]() |
When I was selecting for lines of diatoms back in August/September, I first plated the cells from liquid culture (the original plates I'm discussing now) to be used in the transformation, scraped those cells into liquid culture (much like the diagram above), and then plated the cells again after a recovery period. These cells plated on fresh plates were then left in constant light after they were used to inoculate liquid cultures. After sitting in this light for months on end, they soon faded from their usual brown hue to white. These cells died.
But the original transformation plates, sitting in a dark, cool place, were still brown. Even though they had been sitting on plates without selection (and more importantly without the addition of fresh nutrients), they appeared to still have some life in them.
So I scraped off as many cells from each transformation plate and transferred them into liquid cultures, without any selection. At this point, I had four different test tubes, one for each of my different plasmid constructs transformed into the diatoms. After a week of surprisingly rampant growth, I decided to see if they were still resistant to antibiotics.
Which they were! YEAH SCIENCE!
This past week I have since transferred them to larger liquid cultures to allow the resistant clones to proliferate. I will then plate all of these cells onto multiple selective agar plates, and allow them to grow up before placing them in a cooler, darker place in the culture room.
Until I plate my cultures and select for single colonies (as shown in the last stage of the graphic), I will have "pools" of transformed diatoms for each of my constructs: two different constructs for the nitrate reductase and and nitrite reductase genes. Because of the random insertion of the plasmid DNA into the genomic DNA of the diatom from the particle bombardment, each clone we can separate from the rest of the pool will be distinct from all of the others. This means we have the potential of growing hundreds of different lines of diatoms given the opportunity (or from what was left on the transformation plates).
It will be interesting to see what I do with these lines. If I have time this summer and some money to support me, I may try playing around with different culturing techniques to bolster a manuscript to submit to a journal.
Saturday, February 18, 2012
An untitled post about my advisory meeting and a busy semester
Recently, several different groups of people have been asking for permission to use my photos which always is very flattering. Currently, the Clark homepage is using my picture of the Jonas Clark building. Just below that picture on the front page is a video I made, which is a part of a series asking Clarkies what their favorite things are from area restaurants to classes. The Graduate School at Clark has also asked me for my permission to use my photos, but they haven't picked them out yet. Additionally, I've been asked to share my pictures and videos from our October snow storm to be used as part of a new class at Clark that is chronicling the changing landscape of the campus on a historical timescale.
At the end of last week (just over a week now), I had my first thesis committee meeting for my master's project. My committee is comprised of my adviser Dr. Robertson, the genetics professor Dr. Thackeray and my undergraduate adviser Dr. Hibbett. The role of my committee is to make sure my project is on the right track, give me advice, and determine whether my work is worthy of a master's degree. This meeting was the first time I've presented my work outside of my lab, so it was a real test of my knowledge and presentation skills. This is something I will be practicing a lot this semester however, since I may be presenting at least thrice more (more about that below). My advisory meeting, save for a few slip ups, went surprisingly well. However, I do have my work cut out for me and it's pretty daunting.
I have the opportunity to present my work at 51st Annual Northeast Algal Society meeting in April, either in a poster or oral format. Additionally, I may also present my work here on campus alongside a collection of research projects representing the Clark Graduate School. These presentations are of course in addition to my thesis defense, which I hope will happen in May.
From my thesis committee meeting and my potentially busy presentation schedule, I have a long list of things I need to accomplish:
![]() |
| Preparing for my advisory meeting. |
I have the opportunity to present my work at 51st Annual Northeast Algal Society meeting in April, either in a poster or oral format. Additionally, I may also present my work here on campus alongside a collection of research projects representing the Clark Graduate School. These presentations are of course in addition to my thesis defense, which I hope will happen in May.
From my thesis committee meeting and my potentially busy presentation schedule, I have a long list of things I need to accomplish:
- First I need to fix my quantitative PCR reactions, so I can collect data for my project. More on this topic later...
- Second, after I fix my quantitative PCR reactions, I need to complete a lot of bench work that includes growing discrete lines of diatoms, processing them through experimental assays, extracting their RNA, and preparing the RNA for quantification through QPCR.
- This brings me to collecting all of the data I can to support my thesis through many rounds of quantitative PCR.
- In and around here there are multiple experiments and procedures I need to complete to double check on certain things, like sequence my plasmid DNA used to transform the diatoms and check for the number of construct copies each of my diatom lines received in the genetic transformation.
- I also will need to prepare for each presentation and make sure everything is pulled together.
Tuesday, February 7, 2012
New primers and real-time PCR
I've received my new primers and already run a couple different reactions with some results that prove to be promising and others that are frustrating.
The first thing to do with a new set of primers is to run them in a normal PCR reaction to see if the primers amplify the correct length of DNA. While I could do this with my super concentrated, ultra clean plasmid DNA that I used to transform my diatoms (which would serve as the ultimate positive control), I decided to be be bold and try to amplify my complimentary DNA (cDNA) samples. This cDNA was made from mRNA that was extracted from diatom cells exposed to different environmental conditions. Because the mRNA we're looking for contains GFP, anything that is amplified essentially means that our plasmid DNA that we transformed into this line of diatoms is being expressed, which is a great, great thing.
So I ran this PCR reaction with my new primers to amplify my cDNA and this is the gel I got:
There are some pretty convincing bands in that gel which is really encouraging. It appears that all but two of my reactions (6 out of 8) gave us at least some PCR product.
I then ran a real-time PCR reaction called a standard curve, where the source DNA is serially diluted ten fold (I ran 1:1 through 1:10,000 dilutions). For this reaction, I do go ahead and use the plasmid DNA control to give us the cleanest results possible. This reaction allows us to see how efficient the primers are at doubling the amount of DNA product at each PCR cycle.
You can see in this gel (in the first 5 lanes) that a lot of PCR product is being produced. Each reaction hit their saturation point which is why each reaction looks the same even though they had drastically different amounts of starting DNA template. The great this about real-time PCR is that we can see on the computer screen how each reaction was amplified in real time, and see where each reaction it a ceiling amount of DNA. In this reaction I could see that even the 1:10,000 dilution easily hit this ceiling before the 40th (and final) cycle.
With these two encouraging results--the proper amplification using my new primers in a standard PCR reaction and strong amplification in my standard curve using plasmid DNA--I went ahead and tried amplifying my cDNA in a real-time PCR reaction.
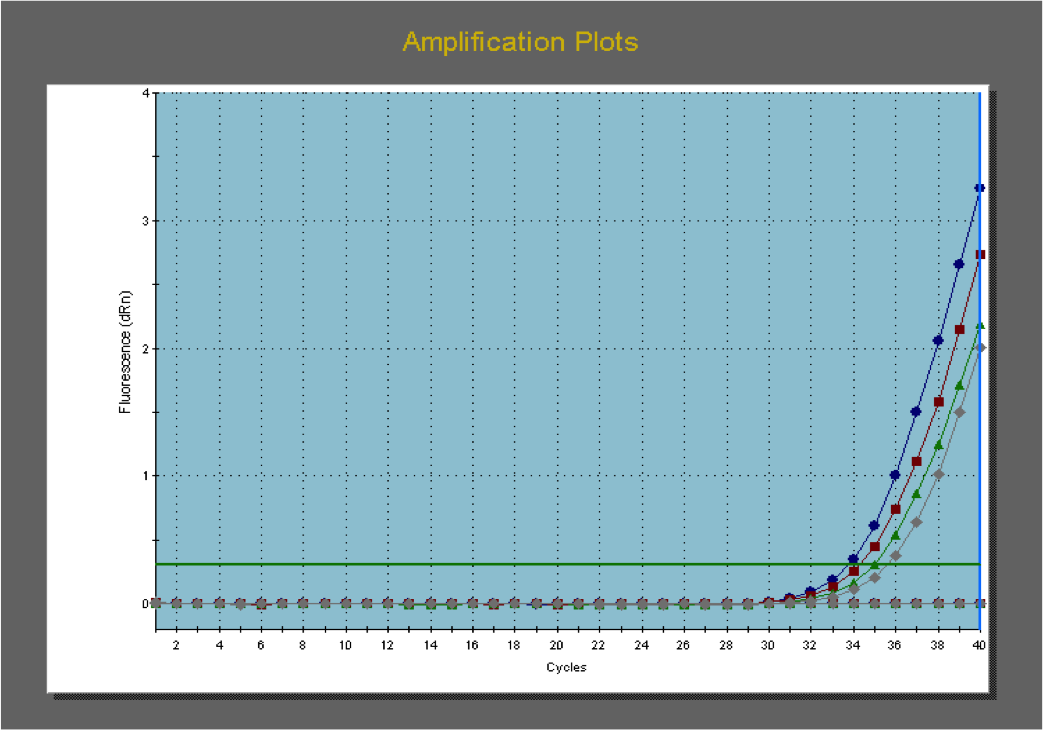
Unfortunately, I ran into the same problem I've been having for a few weeks now (see the bottom half of this post).
Not all of my reactions amplified, and those that did didn't amplify as cleanly as I wanted them to. I ran a gel of my second real-time PCR reaction, which visualizes the two amplified reactions (lanes 3 and 6 starting from the top).
While this is certainly a set back, I have a couple of things I'm going to try. Most importantly, I've ordered a new kit to run the real-time PCR reactions, since the kit I was using was "old." Next, there are a few things I can do to ensure my reactions are as balanced and clean as possible. Finally, I'm going to drop the annealing temperature of my real-time PCR. While I was using the same annealing temperature from my standard PCR, there are two main things that differ between my standard and real-time PCR reactions. First, the salt concentrations are most likely different (although that's a bit annoying to look up, but it's on my to do list), which I found out while screening my diatoms can really screw up a PCR reaction. Second, I used the mysterious "Q-solution" provided by the company Qiagen in their PCR kit when setting up my standard PCR reactions. This may also have significantly changed my standard PCR reaction. While the real-time PCR reaction really should be working with my current set up, it's very possible that my primers are finding it difficult to "seek out" and bind to the sparse cDNA that I want them to amplify.
![]() |
| Yeah, encouraging :] |
So I ran this PCR reaction with my new primers to amplify my cDNA and this is the gel I got:
There are some pretty convincing bands in that gel which is really encouraging. It appears that all but two of my reactions (6 out of 8) gave us at least some PCR product.
![]() |
| Nicccccce :D |
You can see in this gel (in the first 5 lanes) that a lot of PCR product is being produced. Each reaction hit their saturation point which is why each reaction looks the same even though they had drastically different amounts of starting DNA template. The great this about real-time PCR is that we can see on the computer screen how each reaction was amplified in real time, and see where each reaction it a ceiling amount of DNA. In this reaction I could see that even the 1:10,000 dilution easily hit this ceiling before the 40th (and final) cycle.
With these two encouraging results--the proper amplification using my new primers in a standard PCR reaction and strong amplification in my standard curve using plasmid DNA--I went ahead and tried amplifying my cDNA in a real-time PCR reaction.
Unfortunately, I ran into the same problem I've been having for a few weeks now (see the bottom half of this post).
![]() |
| Sad face real-time PCR :[ |
While this is certainly a set back, I have a couple of things I'm going to try. Most importantly, I've ordered a new kit to run the real-time PCR reactions, since the kit I was using was "old." Next, there are a few things I can do to ensure my reactions are as balanced and clean as possible. Finally, I'm going to drop the annealing temperature of my real-time PCR. While I was using the same annealing temperature from my standard PCR, there are two main things that differ between my standard and real-time PCR reactions. First, the salt concentrations are most likely different (although that's a bit annoying to look up, but it's on my to do list), which I found out while screening my diatoms can really screw up a PCR reaction. Second, I used the mysterious "Q-solution" provided by the company Qiagen in their PCR kit when setting up my standard PCR reactions. This may also have significantly changed my standard PCR reaction. While the real-time PCR reaction really should be working with my current set up, it's very possible that my primers are finding it difficult to "seek out" and bind to the sparse cDNA that I want them to amplify.
Labels:
diatoms,
gel,
PCR,
primers,
q solution,
QPCR,
QRT-PCR,
research,
troubleshooting
Monday, January 30, 2012
Extracting RNA from DIATOMZ
In order to measure transcript abundance to collect data for my project, I need to extract RNA from frozen diatom cells. These diatom cells remain "frozen in time" from my experimental assays, which expose lines of diatoms to ammonium. By freezing the cells in liquid nitrogen, I can later extract their RNA and get a good idea of what the transcript abundance was at that time.
To find out more about my experimental assays click on the link up there (which is also here) and then watch my video down below about RNA extractions. These videos together describe some of the most important work for my project!
Sunday, January 29, 2012
Diatom Culling, Revisited
A few weeks ago, I posted about staving off a massive culling of diatoms.
As of right now, my diatoms are still on the mend but I hope to have things all sorted out and lined up by the end of the week. To do this, I'll be checking on my plates and ensuring all of my diatom lines are accounted for before I clean out the culture room, which is in desperate need of being tidied up.
In the video below, I give my account of what it was like to prevent my diatoms from dying. Hopefully I will have been successful in doing so.
As of right now, my diatoms are still on the mend but I hope to have things all sorted out and lined up by the end of the week. To do this, I'll be checking on my plates and ensuring all of my diatom lines are accounted for before I clean out the culture room, which is in desperate need of being tidied up.
In the video below, I give my account of what it was like to prevent my diatoms from dying. Hopefully I will have been successful in doing so.
Tuesday, January 24, 2012
Designing better RT-PCR primers
Last post I talked about amplifying DNA by real time-PCR, which measures the number of amplified copies at the end of each cycle, giving researchers "real time" numbers of DNA copies. To do this however, you need appropriate primers to get the job done. Not only do they have to be specific enough to work only for the DNA you want amplified, but I'm learning there are other tricks you need to abide by.
Let's back up a little bit though and look at transcription and translation. After all, I'm after the mRNA transcripts that are made in this process. With my genetically engineered construct, protein synthesis starts when transcription factors bind within the cloned 5' untranslated region (UTR) and begin transcription at the promoter, transcribing all of the way through the eGFP open reading frame (ORF) and through the 3' UTR. Now we have an mRNA transcript with part of the 5' and 3' UTR intact at either end of the eGFP coding region. This will serve as the template for translation, which begins at the start codon of the ORF and ends at the stop codon. The 5' and 3' UTR are not translated, hence their UTR moniker.
My project is aiming to measure the amount of mRNA transcript in cells under different environmental conditions. It's not easy to measure mRNA by itself, but it is very easy to measure DNA. Using mRNA as a template, you can make complimentary DNA using the enzyme reverse transcriptase.
Reverse transcriptase starts at the 3' end on an mRNA molecule and transcribes a complimentary strand backwards along the mRNA. However, reverse transcriptase will eventually fall off (represented by the fading orange triangle), so smaller mRNA transcripts work the best.
If I have this mRNA transcript that I want to measure through RT-PCR (after I've converted it into cDNA with reverse transcriptase), I need a primer to amplify the eGFP coding region.
I first made this primer pair to test for the presence of eGFP in my diatom cell lines. It amplifies most of the eGFP coding region by attaching at points just inside of the gene, as you can see below.
Unfortunately, these primers aren't working very well when it comes to applying them to real time-PCR.
My control real time-PCR reactions have worked pretty well for me each and every trial I've run. The control reactions use primers to amplify the endogenous genes we're manipulating in our system, which serve as a good comparison to the experimental reactions.
You can see on the graph at right that the primers amplifying endogenous genes work pretty well, developing curves within an appropriate cycle range (the number of cycles until a noticeable amount of product can be measured).
However, when I look at the graph for the transgenic lines using the above primers to amplify eGFP, I get a graph like this on the left. The amplification lines are severely delayed and do not approach the same level of product by the end of the reaction.
In addition to amplification plots, the real-time PCR application on the testing computer also shows graphs that display the melting point of the double stranded DNA molecules. These graphs can be very informative when troubleshooting real time-PCR reactions.
Here is the dissociation curve of the endogenous amplifications:
Oh boy, it's that curve crisp and clean.
Here is the dissociation curve of the transgenic amplifications:
Yeah, not so much. This curve is extremely messy and non uniform. This provides further evidence that my primers for this reaction might not being working as well as they should be.
After talking to my adviser and seeking some advice online, I've found a couple of parameters to follow to make better primers.
First and foremost (and going back to my bit about reverse transcriptase starting at the 3' end of the mRNA transcripts), my adviser let me in on a secret: I should be using primers that amplify near the 3' end of the transcript since that will be the highest quality region of cDNA as it is transcribed. Using this knowledge, I am working on primers that amplify in the area represented by the orange square, just outside of the 3' UTR. I also tweaked the settings which the primers conform to, based on information I found on other university websites. Yay for Google and other scientists!
The past few days in lab I've been working on these primers and planning out my semester of science ahead of me. Just this week I put together my thesis committee (Justin Thackeray who I had for genetics three years ago, and David Hibbett, my undergraduate adviser) and I've begun re-reading some primary literature and will soon begin reading more broadly and in depth in preparation of writing my thesis. I've also started putting together bits of my paper, which I should have done a while ago.
Anyway, that's all for now, really.
If you've gotten this far, watch my latest YouTubes video regarding this topic matter:
Let's back up a little bit though and look at transcription and translation. After all, I'm after the mRNA transcripts that are made in this process. With my genetically engineered construct, protein synthesis starts when transcription factors bind within the cloned 5' untranslated region (UTR) and begin transcription at the promoter, transcribing all of the way through the eGFP open reading frame (ORF) and through the 3' UTR. Now we have an mRNA transcript with part of the 5' and 3' UTR intact at either end of the eGFP coding region. This will serve as the template for translation, which begins at the start codon of the ORF and ends at the stop codon. The 5' and 3' UTR are not translated, hence their UTR moniker.My project is aiming to measure the amount of mRNA transcript in cells under different environmental conditions. It's not easy to measure mRNA by itself, but it is very easy to measure DNA. Using mRNA as a template, you can make complimentary DNA using the enzyme reverse transcriptase.
Reverse transcriptase starts at the 3' end on an mRNA molecule and transcribes a complimentary strand backwards along the mRNA. However, reverse transcriptase will eventually fall off (represented by the fading orange triangle), so smaller mRNA transcripts work the best.If I have this mRNA transcript that I want to measure through RT-PCR (after I've converted it into cDNA with reverse transcriptase), I need a primer to amplify the eGFP coding region.
I first made this primer pair to test for the presence of eGFP in my diatom cell lines. It amplifies most of the eGFP coding region by attaching at points just inside of the gene, as you can see below.
Unfortunately, these primers aren't working very well when it comes to applying them to real time-PCR.
My control real time-PCR reactions have worked pretty well for me each and every trial I've run. The control reactions use primers to amplify the endogenous genes we're manipulating in our system, which serve as a good comparison to the experimental reactions.You can see on the graph at right that the primers amplifying endogenous genes work pretty well, developing curves within an appropriate cycle range (the number of cycles until a noticeable amount of product can be measured).
However, when I look at the graph for the transgenic lines using the above primers to amplify eGFP, I get a graph like this on the left. The amplification lines are severely delayed and do not approach the same level of product by the end of the reaction.In addition to amplification plots, the real-time PCR application on the testing computer also shows graphs that display the melting point of the double stranded DNA molecules. These graphs can be very informative when troubleshooting real time-PCR reactions.
Here is the dissociation curve of the endogenous amplifications:
Oh boy, it's that curve crisp and clean.
Here is the dissociation curve of the transgenic amplifications:
![]() |
After talking to my adviser and seeking some advice online, I've found a couple of parameters to follow to make better primers.
First and foremost (and going back to my bit about reverse transcriptase starting at the 3' end of the mRNA transcripts), my adviser let me in on a secret: I should be using primers that amplify near the 3' end of the transcript since that will be the highest quality region of cDNA as it is transcribed. Using this knowledge, I am working on primers that amplify in the area represented by the orange square, just outside of the 3' UTR. I also tweaked the settings which the primers conform to, based on information I found on other university websites. Yay for Google and other scientists!The past few days in lab I've been working on these primers and planning out my semester of science ahead of me. Just this week I put together my thesis committee (Justin Thackeray who I had for genetics three years ago, and David Hibbett, my undergraduate adviser) and I've begun re-reading some primary literature and will soon begin reading more broadly and in depth in preparation of writing my thesis. I've also started putting together bits of my paper, which I should have done a while ago.
Anyway, that's all for now, really.
If you've gotten this far, watch my latest YouTubes video regarding this topic matter:
Labels:
diatoms,
lab work,
PCR,
real time pcr,
thesis,
troubleshooting
Oh, winter is here, okay, thought it wasn't coming
Ever since Worcester got slammed with snow and ice just before Halloween, 2011 was pretty mild. In fact, the month of November felt warmer than October, and by the time I went home at the end of the semester, we didn't have any snow in the 01610.
But about a week into the New Year, we finally got a few inches of snow.
And over the past few days, we got a couple inches of snow and ice in small increments.
This snow follows a string of extremely cold days in Worcester, with temperatures in the single digits and teens.
So when I thought winter wasn't coming around this season, I was definitely wrong.
Campus is now covered in snow, but we're still well behind the amount of snow we got last year.
But I'm okay with that. Cars have already been struggling to make it up the lame excuse of a hill my road is on due to the snow and ice. I'm pretty sure one of these days a car is going to careen into another, because everyone seems to think it's a great idea to simply floor it when they lack traction on the ice.
While we may get a few warm days in this coming week, we may get two doses of freezing ran. That's something I really don't look forward to.
(Tuesday the 24th update: it rained last night and was in the upper 40's today. All of the snow not piled up is gone. Ha! New England weather!)
But about a week into the New Year, we finally got a few inches of snow.
![]() |
| A view of the JC (left) and the AC (right) from Atwood Hall. |
And over the past few days, we got a couple inches of snow and ice in small increments.
![]() |
| A view of the AC on Sunday morning. |
So when I thought winter wasn't coming around this season, I was definitely wrong.
| The Zen Garden looks like a mini snow bowl. |
But I'm okay with that. Cars have already been struggling to make it up the lame excuse of a hill my road is on due to the snow and ice. I'm pretty sure one of these days a car is going to careen into another, because everyone seems to think it's a great idea to simply floor it when they lack traction on the ice.
While we may get a few warm days in this coming week, we may get two doses of freezing ran. That's something I really don't look forward to.
(Tuesday the 24th update: it rained last night and was in the upper 40's today. All of the snow not piled up is gone. Ha! New England weather!)
Friday, January 20, 2012
PCR in Real Time
I really like graphics, and I make a lot of them to represent my lab work.
Below is a graphic that represents my lab project. So far, I've gone through the greens, yellows, pinks & blues and am working in the orange to red zone. Well, I still ave some blue work to do, but I'm currently working on orange zone material
That is, I'm trying to amplify cDNA derived from frozen cell samples to make estimates of gene expression from my different lines of transformed diatoms.
"Regular" or endpoint PCR can hit a duplication plateau that isn't limited by the amount of starting template in a reaction, and therefore usually only gives a positive or negative result (yes there is product or no there isn't). Real time-PCR on the other hand lets us see the amount of amplified product as PCR cycles progress and lets us accurately quantify the amount of DNA that is being amplified each round. By using specific primers that only amplify one region within a pool of DNA, we can determine how much particular DNA we had to start with.
Let's say the cartoon to the left here represents our real time-PCR experiment, and we have a pool of cDNA waiting to be amplified. We have primers ready to amplify the pink cDNA and the dark blue cDNA. Using these primers, we set up a reaction to amplify the pink cDNA and a separate reaction to amplify the dark blue cDNA. If we incorporate a special dye into each reaction, any double stranded DNA that is amplified by the primers with fluoresce, which can then be measure by the real time-PCR machine. This data is then put into graph form, and we can track the amplification of DNA in real time as the experiment progresses. In the cartoon, you can see the pink cDNA starts at 2x and the dark blue cDNA starts at 1x in terms of starting cDNA template. As such, the amount of cDNA that is made (and therefore the amount fluorescence given off) will vary.
In the graph on the right, we can see the difference in fluorescence between the different amplification reactions. Here the red, blue, and gray lines are almost identical, and are far ahead of the green line. This means that these three lines have much more starting cDNA template than the green line.
This is the approach I will take in measuring the gene expression in my experiments, if I can get my primers to work. But more on that in a later post.
Below is a graphic that represents my lab project. So far, I've gone through the greens, yellows, pinks & blues and am working in the orange to red zone. Well, I still ave some blue work to do, but I'm currently working on orange zone material
![]() |
| My project in a very small nutshell the size of your computer screen. |
"Regular" or endpoint PCR can hit a duplication plateau that isn't limited by the amount of starting template in a reaction, and therefore usually only gives a positive or negative result (yes there is product or no there isn't). Real time-PCR on the other hand lets us see the amount of amplified product as PCR cycles progress and lets us accurately quantify the amount of DNA that is being amplified each round. By using specific primers that only amplify one region within a pool of DNA, we can determine how much particular DNA we had to start with.
Let's say the cartoon to the left here represents our real time-PCR experiment, and we have a pool of cDNA waiting to be amplified. We have primers ready to amplify the pink cDNA and the dark blue cDNA. Using these primers, we set up a reaction to amplify the pink cDNA and a separate reaction to amplify the dark blue cDNA. If we incorporate a special dye into each reaction, any double stranded DNA that is amplified by the primers with fluoresce, which can then be measure by the real time-PCR machine. This data is then put into graph form, and we can track the amplification of DNA in real time as the experiment progresses. In the cartoon, you can see the pink cDNA starts at 2x and the dark blue cDNA starts at 1x in terms of starting cDNA template. As such, the amount of cDNA that is made (and therefore the amount fluorescence given off) will vary.
In the graph on the right, we can see the difference in fluorescence between the different amplification reactions. Here the red, blue, and gray lines are almost identical, and are far ahead of the green line. This means that these three lines have much more starting cDNA template than the green line.This is the approach I will take in measuring the gene expression in my experiments, if I can get my primers to work. But more on that in a later post.
Wednesday, January 18, 2012
Unflagging speed
The start of the semester is beginning with unflagging speed, and I find myself dazed from the extreme acceleration. I’m desperately trying to prevent further acceleration and maintain a steady pace so I can catch up and organize my plan of attack on these beastly final few months.
I have tons to be worried about this semester too, which is just fantastic:
All of this to me seems incredibly daunting, especially since I haven’t had much spare time after I got back from my trip to Florida thanks to a lot of time at the bookstore. But there is a glimmer of hope at the end of this dark, damp tunnel that is the beginning of the semester.
I hope to essentially eliminate all of my commitment to the bookstore after next week, freeing up a lot of my time, which I can devote to lab work. I also hope to get my project on track really soon, and have a set of goals by the end of the month. If I can get my project on track by then, I can grind out a lot of lab work over the month on February (thankfully we have that extra leap year day).
Then I could have the month of March (which includes a week of spring break) to collect my thoughts and write my paper and put together a presentation.
I can’t decide whether I’m tricking myself into thinking this is feasible, but I guess that’s the only option I have right now. The only option I have is to tear this semester apart and make it mine.
The remainder of this week is already completely full of plans to start my project back up again and working at the bookstore. While I’ll miss the extra income from working at the bookstore, I can’t wait to devote all of my spare time into my project so I can get comfortable with it’s progress and outcome once again. Once things slow down with the beginning of the semester at the end of next week, I’ll be taken off the schedule and I can devote entire days to lab and do a lot more with my blog and do more blog projects, which is something else I’m looking forward to. More science with my next post, which I'll post soon!
I have tons to be worried about this semester too, which is just fantastic:
- I should hear back from grad schools within the next few weeks
- I need to correct and tweak my lab experiments as soon as possible so I can collect data worthy of a Master’s thesis
- I need to then find time to conduct those experiments and collect that data
- Following that, I need to write my thesis and prepare a lengthy presentation
- I should probably also defend my thesis in front of a treacherous jury (complete with torches and spears)
- Aside from my Master’s work, I’m going to be helping out with a research seminar in my lab, which has the potential to eat up a lot of my time, especially in the second semester
- And it would also be great if I could make some money
| Slaving away at the bookstore. |
| Things are the bookstore have looked like this recently: were does the work start and where does it end? |
Then I could have the month of March (which includes a week of spring break) to collect my thoughts and write my paper and put together a presentation.
I can’t decide whether I’m tricking myself into thinking this is feasible, but I guess that’s the only option I have right now. The only option I have is to tear this semester apart and make it mine.
The remainder of this week is already completely full of plans to start my project back up again and working at the bookstore. While I’ll miss the extra income from working at the bookstore, I can’t wait to devote all of my spare time into my project so I can get comfortable with it’s progress and outcome once again. Once things slow down with the beginning of the semester at the end of next week, I’ll be taken off the schedule and I can devote entire days to lab and do a lot more with my blog and do more blog projects, which is something else I’m looking forward to. More science with my next post, which I'll post soon!
Subscribe to:
Posts (Atom)