Showing posts with label QPCR. Show all posts

Monday, February 27, 2012

Positive Preliminary Results

My post today doesn't get more clearer than the post title.

In re-examining my preliminary data on Wednesday, I realized I had collected some positive results! I had run a set of samples through a QRT-PCR reaction on Tuesday with the new primers that I received on Monday. These samples were from my experimental assays and represented different time points and test conditions. When I looked at the results on Tuesday, I didn't think much of them, other than the fact that my no template controls (the reactions that are supposed to be blanks) gave me some product, indicating the reactions are still not 100% clean.

But when I went back to the numbers the computer gave me for my test samples, I realized I overlooked the initial data. This is because the data that the program gives me is sort of backwards and not entirely intuitive in the way that I'm using it. The program gives me cycle threshold (Ct) values (marked by the dotted red line in the graph), or the number of cycles that it took a sample to reach a certain threshold in terms of amplified product. This allows us to directly compare the amount of starting product (cDNA) between two samples. For instance, if sample A has a Ct value of 25.88 and B has a Ct of 27.34, sample A had more starting template since it crossed the threshold at an earlier cycle. This is where it gets confusing. In my mindset, the higher value would have more product, but really, it's the other way around. When comparing these values between different samples and time points, it gets even more confusing in determining whether there are changes in starting template.

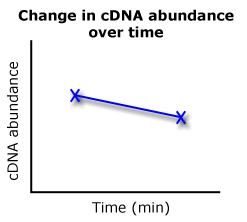
If sample A was the time 0 value and sample B was the time 60 value, we'd essentially get a graph like this on the right. Sample A's Ct of 25.88 is greater in cDNA abundance than sample B's 27.34 Ct. My QPCR comparisons will look a lot like these two cartoons, where I compare Ct values and determine what that data looks like on a graph.

So here I am going back through the data, comparing starting Ct values (0 minutes) with end Ct values (60 minutes) between two different treatments and DNA constructs from my transformed diatoms. Of these eight Ct values (four combinations, two time points each), I realized I had something. My three "controls" all showed the appropriate increase or decrease in mRNA transcript levels, mirroring previously established results by our lab. But when I looked at the experimental line of diatoms, the line I'm most interested, this pattern completely changed from its control. OHHHH YEAHHHH.

Positive preliminary results: victory!
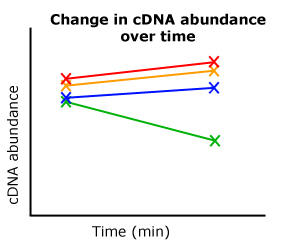
The cool part was that my real hardline controls were basically the same between both conditions (the orange and red here below), show how accurate my techniques were in collecting that data. But really, my favorite part was the dramatic shift in the results for my experimental line (the blue line). This is really, really exciting. Essentially, if my hypothesis was wrong, the blue line should have looked just like the green line. The green line here is the down-regulated transcript levels previously established by my lab. However, there is a stark difference in the transcript levels (cDNA abundance) between the normally down-regulated line (green) and the experimental line (blue). This strongly suggests I'm on the right track. *phew*
A cartoon representing my results.

However, I'm not out of the woods yet. I'm still having trouble with my primers and I may need to order the primers a third time. My no template controls are still giving me product, but that may be due to primer dimers. I'm going to run a gel in an attempt to see what is going on, but I may have to eventually sequence the bands to see whether I have some plasmid DNA contamination that I don't know about. All of this will be sorted out, hopefully, sooner or later. But I have some other projects going on that I really should take care of as well. Juggling so many different things is really time consuming, but that's a topic for another time.

Tuesday, February 7, 2012

New primers and real-time PCR

I've received my new primers and already run a couple different reactions with some results that prove to be promising and others that are frustrating.

Yeah, encouraging :]
The first thing to do with a new set of primers is to run them in a normal PCR reaction to see if the primers amplify the correct length of DNA. While I could do this with my super concentrated, ultra clean plasmid DNA that I used to transform my diatoms (which would serve as the ultimate positive control), I decided to be be bold and try to amplify my complimentary DNA (cDNA) samples. This cDNA was made from mRNA that was extracted from diatom cells exposed to different environmental conditions. Because the mRNA we're looking for contains GFP, anything that is amplified essentially means that our plasmid DNA that we transformed into this line of diatoms is being expressed, which is a great, great thing.

So I ran this PCR reaction with my new primers to amplify my cDNA and this is the gel I got:

There are some pretty convincing bands in that gel which is really encouraging. It appears that all but two of my reactions (6 out of 8) gave us at least some PCR product.

Nicccccce :D
I then ran a real-time PCR reaction called a standard curve, where the source DNA is serially diluted ten fold (I ran 1:1 through 1:10,000 dilutions). For this reaction, I do go ahead and use the plasmid DNA control to give us the cleanest results possible. This reaction allows us to see how efficient the primers are at doubling the amount of DNA product at each PCR cycle.

You can see in this gel (in the first 5 lanes) that a lot of PCR product is being produced. Each reaction hit their saturation point which is why each reaction looks the same even though they had drastically different amounts of starting DNA template. The great this about real-time PCR is that we can see on the computer screen how each reaction was amplified in real time, and see where each reaction it a ceiling amount of DNA. In this reaction I could see that even the 1:10,000 dilution easily hit this ceiling before the 40th (and final) cycle.

With these two encouraging results--the proper amplification using my new primers in a standard PCR reaction and strong amplification in my standard curve using plasmid DNA--I went ahead and tried amplifying my cDNA in a real-time PCR reaction.

Unfortunately, I ran into the same problem I've been having for a few weeks now (see the bottom half of this post).

Sad face real-time PCR :[
Not all of my reactions amplified, and those that did didn't amplify as cleanly as I wanted them to. I ran a gel of my second real-time PCR reaction, which visualizes the two amplified reactions (lanes 3 and 6 starting from the top).

While this is certainly a set back, I have a couple of things I'm going to try. Most importantly, I've ordered a new kit to run the real-time PCR reactions, since the kit I was using was "old." Next, there are a few things I can do to ensure my reactions are as balanced and clean as possible. Finally, I'm going to drop the annealing temperature of my real-time PCR. While I was using the same annealing temperature from my standard PCR, there are two main things that differ between my standard and real-time PCR reactions. First, the salt concentrations are most likely different (although that's a bit annoying to look up, but it's on my to do list), which I found out while screening my diatoms can really screw up a PCR reaction. Second, I used the mysterious "Q-solution" provided by the company Qiagen in their PCR kit when setting up my standard PCR reactions. This may also have significantly changed my standard PCR reaction. While the real-time PCR reaction really should be working with my current set up, it's very possible that my primers are finding it difficult to "seek out" and bind to the sparse cDNA that I want them to amplify.