Monday, February 27, 2012

Positive Preliminary Results

My post today doesn't get more clearer than the post title.

In re-examining my preliminary data on Wednesday, I realized I had collected some positive results! I had run a set of samples through a QRT-PCR reaction on Tuesday with the new primers that I received on Monday. These samples were from my experimental assays and represented different time points and test conditions. When I looked at the results on Tuesday, I didn't think much of them, other than the fact that my no template controls (the reactions that are supposed to be blanks) gave me some product, indicating the reactions are still not 100% clean.

But when I went back to the numbers the computer gave me for my test samples, I realized I overlooked the initial data. This is because the data that the program gives me is sort of backwards and not entirely intuitive in the way that I'm using it. The program gives me cycle threshold (Ct) values (marked by the dotted red line in the graph), or the number of cycles that it took a sample to reach a certain threshold in terms of amplified product. This allows us to directly compare the amount of starting product (cDNA) between two samples. For instance, if sample A has a Ct value of 25.88 and B has a Ct of 27.34, sample A had more starting template since it crossed the threshold at an earlier cycle. This is where it gets confusing. In my mindset, the higher value would have more product, but really, it's the other way around. When comparing these values between different samples and time points, it gets even more confusing in determining whether there are changes in starting template.

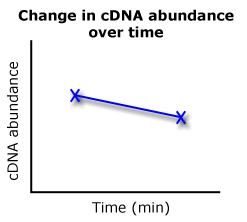
If sample A was the time 0 value and sample B was the time 60 value, we'd essentially get a graph like this on the right. Sample A's Ct of 25.88 is greater in cDNA abundance than sample B's 27.34 Ct. My QPCR comparisons will look a lot like these two cartoons, where I compare Ct values and determine what that data looks like on a graph.

So here I am going back through the data, comparing starting Ct values (0 minutes) with end Ct values (60 minutes) between two different treatments and DNA constructs from my transformed diatoms. Of these eight Ct values (four combinations, two time points each), I realized I had something. My three "controls" all showed the appropriate increase or decrease in mRNA transcript levels, mirroring previously established results by our lab. But when I looked at the experimental line of diatoms, the line I'm most interested, this pattern completely changed from its control. OHHHH YEAHHHH.

Positive preliminary results: victory!
The cool part was that my real hardline controls were basically the same between both conditions (the orange and red here below), show how accurate my techniques were in collecting that data. But really, my favorite part was the dramatic shift in the results for my experimental line (the blue line). This is really, really exciting. Essentially, if my hypothesis was wrong, the blue line should have looked just like the green line. The green line here is the down-regulated transcript levels previously established by my lab. However, there is a stark difference in the transcript levels (cDNA abundance) between the normally down-regulated line (green) and the experimental line (blue). This strongly suggests I'm on the right track. *phew*
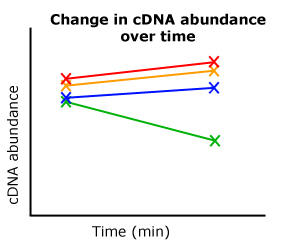
A cartoon representing my results.

However, I'm not out of the woods yet. I'm still having trouble with my primers and I may need to order the primers a third time. My no template controls are still giving me product, but that may be due to primer dimers. I'm going to run a gel in an attempt to see what is going on, but I may have to eventually sequence the bands to see whether I have some plasmid DNA contamination that I don't know about. All of this will be sorted out, hopefully, sooner or later. But I have some other projects going on that I really should take care of as well. Juggling so many different things is really time consuming, but that's a topic for another time.

Wednesday, February 22, 2012

A picture, a video, and another picture

I need to come back to this spot and give this shot another, wider try. But I liked it enough to post.

This is one of the stairwells in the biology building, a spot I particularly like. (More content below)


I did go back a little later and took this wider shot, which I like a lot more:


I put together the video below, which has a long intro (:-p) and a hidden something or other, which is kind of embarrassing, as the end.


And I'll leave you with this Facebook gem. My friend Dan apparently had a bit of trouble with his lab lizards today:

Sunday, February 19, 2012

Resurrecting old lines of transformed diatoms

I've begun the process of resurrecting old lines of transformed diatoms for future use in experiments in my lab. These diatom cells are from the original agar plates used in the particle bombardment genetic transformations. Currently, I have about 30 discrete lines of diatoms, each with one of my four different experimental plasmid DNA constructs. I'd like to dramatically increase that number if the need arises. The goal is to have a giant pool of diatoms, separated by the type of DNA with which they were transformed.

The overall process is outlined below:

As I stated in the graphic, these lines of diatoms come from the original transformation plates I used to start the discrete lines of diatoms I have now. After using them, I placed them underneath the rack where I grow my diatoms. As this shelf is not a solid plane, limited light did reach these plates. However, the amount of light they did receive was very limited in comparison to the normal growth conditions. This was the only reason why these cells appeared to be alive when I looked at them again recently.

When I was selecting for lines of diatoms back in August/September, I first plated the cells from liquid culture (the original plates I'm discussing now) to be used in the transformation, scraped those cells into liquid culture (much like the diagram above), and then plated the cells again after a recovery period. These cells plated on fresh plates were then left in constant light after they were used to inoculate liquid cultures. After sitting in this light for months on end, they soon faded from their usual brown hue to white. These cells died.

But the original transformation plates, sitting in a dark, cool place, were still brown. Even though they had been sitting on plates without selection (and more importantly without the addition of fresh nutrients), they appeared to still have some life in them.

So I scraped off as many cells from each transformation plate and transferred them into liquid cultures, without any selection. At this point, I had four different test tubes, one for each of my different plasmid constructs transformed into the diatoms. After a week of surprisingly rampant growth, I decided to see if they were still resistant to antibiotics.

Which they were! YEAH SCIENCE!

This past week I have since transferred them to larger liquid cultures to allow the resistant clones to proliferate. I will then plate all of these cells onto multiple selective agar plates, and allow them to grow up before placing them in a cooler, darker place in the culture room.

Until I plate my cultures and select for single colonies (as shown in the last stage of the graphic), I will have "pools" of transformed diatoms for each of my constructs: two different constructs for the nitrate reductase and and nitrite reductase genes. Because of the random insertion of the plasmid DNA into the genomic DNA of the diatom from the particle bombardment, each clone we can separate from the rest of the pool will be distinct from all of the others. This means we have the potential of growing hundreds of different lines of diatoms given the opportunity (or from what was left on the transformation plates).

It will be interesting to see what I do with these lines. If I have time this summer and some money to support me, I may try playing around with different culturing techniques to bolster a manuscript to submit to a journal.

Saturday, February 18, 2012

An untitled post about my advisory meeting and a busy semester

Recently, several different groups of people have been asking for permission to use my photos which always is very flattering. Currently, the Clark homepage is using my picture of the Jonas Clark building. Just below that picture on the front page is a video I made, which is a part of a series asking Clarkies what their favorite things are from area restaurants to classes. The Graduate School at Clark has also asked me for my permission to use my photos, but they haven't picked them out yet. Additionally, I've been asked to share my pictures and videos from our October snow storm to be used as part of a new class at Clark that is chronicling the changing landscape of the campus on a historical timescale.

Preparing for my advisory meeting.
At the end of last week (just over a week now), I had my first thesis committee meeting for my master's project. My committee is comprised of my adviser Dr. Robertson, the genetics professor Dr. Thackeray and my undergraduate adviser Dr. Hibbett. The role of my committee is to make sure my project is on the right track, give me advice, and determine whether my work is worthy of a master's degree. This meeting was the first time I've presented my work outside of my lab, so it was a real test of my knowledge and presentation skills. This is something I will be practicing a lot this semester however, since I may be presenting at least thrice more (more about that below). My advisory meeting, save for a few slip ups, went surprisingly well. However, I do have my work cut out for me and it's pretty daunting.

I have the opportunity to present my work at 51st Annual Northeast Algal Society meeting in April, either in a poster or oral format. Additionally, I may also present my work here on campus alongside a collection of research projects representing the Clark Graduate School. These presentations are of course in addition to my thesis defense, which I hope will happen in May.

From my thesis committee meeting and my potentially busy presentation schedule, I have a long list of things I need to accomplish:
  • First I need to fix my quantitative PCR reactions, so I can collect data for my project. More on this topic later...
  • Second, after I fix my quantitative PCR reactions, I need to complete a lot of bench work that includes growing discrete lines of diatoms, processing them through experimental assays, extracting their RNA, and preparing the RNA for quantification through QPCR.
  • This brings me to collecting all of the data I can to support my thesis through many rounds of quantitative PCR.
  • In and around here there are multiple experiments and procedures I need to complete to double check on certain things, like sequence my plasmid DNA used to transform the diatoms and check for the number of construct copies each of my diatom lines received in the genetic transformation.
  • I also will need to prepare for each presentation and make sure everything is pulled together.
With so many things going on in my research project, I don't think I'll have much time to do anything else. This is of course without considering the work I need to get done in the class I'm helping out with--Physiological Ecology of Marine Algae. It's very likely I will be leading a group research project with 2-4 undergraduate students. This work will be crammed into about 6 short weeks. While I know this will be a great learning experience for me, I know those weeks are going to be very stressful.

Tuesday, February 7, 2012

New primers and real-time PCR

I've received my new primers and already run a couple different reactions with some results that prove to be promising and others that are frustrating.

Yeah, encouraging :]
The first thing to do with a new set of primers is to run them in a normal PCR reaction to see if the primers amplify the correct length of DNA. While I could do this with my super concentrated, ultra clean plasmid DNA that I used to transform my diatoms (which would serve as the ultimate positive control), I decided to be be bold and try to amplify my complimentary DNA (cDNA) samples. This cDNA was made from mRNA that was extracted from diatom cells exposed to different environmental conditions. Because the mRNA we're looking for contains GFP, anything that is amplified essentially means that our plasmid DNA that we transformed into this line of diatoms is being expressed, which is a great, great thing.

So I ran this PCR reaction with my new primers to amplify my cDNA and this is the gel I got:

There are some pretty convincing bands in that gel which is really encouraging. It appears that all but two of my reactions (6 out of 8) gave us at least some PCR product.

Nicccccce :D
I then ran a real-time PCR reaction called a standard curve, where the source DNA is serially diluted ten fold (I ran 1:1 through 1:10,000 dilutions). For this reaction, I do go ahead and use the plasmid DNA control to give us the cleanest results possible. This reaction allows us to see how efficient the primers are at doubling the amount of DNA product at each PCR cycle.

You can see in this gel (in the first 5 lanes) that a lot of PCR product is being produced. Each reaction hit their saturation point which is why each reaction looks the same even though they had drastically different amounts of starting DNA template. The great this about real-time PCR is that we can see on the computer screen how each reaction was amplified in real time, and see where each reaction it a ceiling amount of DNA. In this reaction I could see that even the 1:10,000 dilution easily hit this ceiling before the 40th (and final) cycle.

With these two encouraging results--the proper amplification using my new primers in a standard PCR reaction and strong amplification in my standard curve using plasmid DNA--I went ahead and tried amplifying my cDNA in a real-time PCR reaction.

Unfortunately, I ran into the same problem I've been having for a few weeks now (see the bottom half of this post).

Sad face real-time PCR :[
Not all of my reactions amplified, and those that did didn't amplify as cleanly as I wanted them to. I ran a gel of my second real-time PCR reaction, which visualizes the two amplified reactions (lanes 3 and 6 starting from the top).

While this is certainly a set back, I have a couple of things I'm going to try. Most importantly, I've ordered a new kit to run the real-time PCR reactions, since the kit I was using was "old." Next, there are a few things I can do to ensure my reactions are as balanced and clean as possible. Finally, I'm going to drop the annealing temperature of my real-time PCR. While I was using the same annealing temperature from my standard PCR, there are two main things that differ between my standard and real-time PCR reactions. First, the salt concentrations are most likely different (although that's a bit annoying to look up, but it's on my to do list), which I found out while screening my diatoms can really screw up a PCR reaction. Second, I used the mysterious "Q-solution" provided by the company Qiagen in their PCR kit when setting up my standard PCR reactions. This may also have significantly changed my standard PCR reaction. While the real-time PCR reaction really should be working with my current set up, it's very possible that my primers are finding it difficult to "seek out" and bind to the sparse cDNA that I want them to amplify.